Free tool · Rent roll analysis
Rent roll analysis.
Drop in a rent roll spreadsheet and get the first read an underwriter does: unit mix, in-place rent against market, loss to lease tested against recent leases, lease expirations, and whether rents are trending up or down. It runs in your browser. No login, no email, and the file is never uploaded.
Drop a rent roll here
Excel (.xlsx) or CSV, one row per unit. Exports from the common property management systems are recognised automatically. The file is read on this page and is not uploaded or stored.
Showing the sample rent roll: a fictional 110-unit property.
Units
110
104 leased · 4 vacant · 2 model or down
Physical occupancy
94.5%
96.3% of rentable units
In-place rent, annual
$1,536,000
$1,761,300 gross potential
Loss to lease, annual
$132,000
7.9% below the market column
Expiring within 6 months
58
56% of 104 leases
Rent trend
Up
New leases +5.7% vs earlier
As of Nov 1, 2026. Rents are monthly unless marked annual.
Rents are trending up
The 12 leases that started in the last 90 days pay 5.7% more than the earlier leases on the same floor plan. The line fitted through all 104 dated leases rises about 7.6% a year.
| Floor plan | Last 90 days | Earlier leases | Recent vs earlier | Trend per year | Fit |
|---|---|---|---|---|---|
| 1BR/1BA · 650sf | 5 at $1,120 | 35 at $1,051 | +6.5% | +$102 (+9.6%) | Strong |
| 2BR/1BA · 850sf | 4 at $1,300 | 36 at $1,233 | +5.4% | +$92 (+7.4%) | Strong |
| 2BR/2BA · 1,000sf | 3 at $1,560 | 21 at $1,491 | +4.6% | +$69 (+4.6%) | Strong |
Trend per year is a straight line fitted through each lease’s rent against its start date, one floor plan at a time, so a change in unit mix cannot pass for a change in rents. Fit says how well the line describes the leases. The call at the top rests on the last 90 days against earlier leases when at least five recent leases are on floor plans that also have earlier ones, and on the fitted line otherwise. Leases with no date are left out of both.
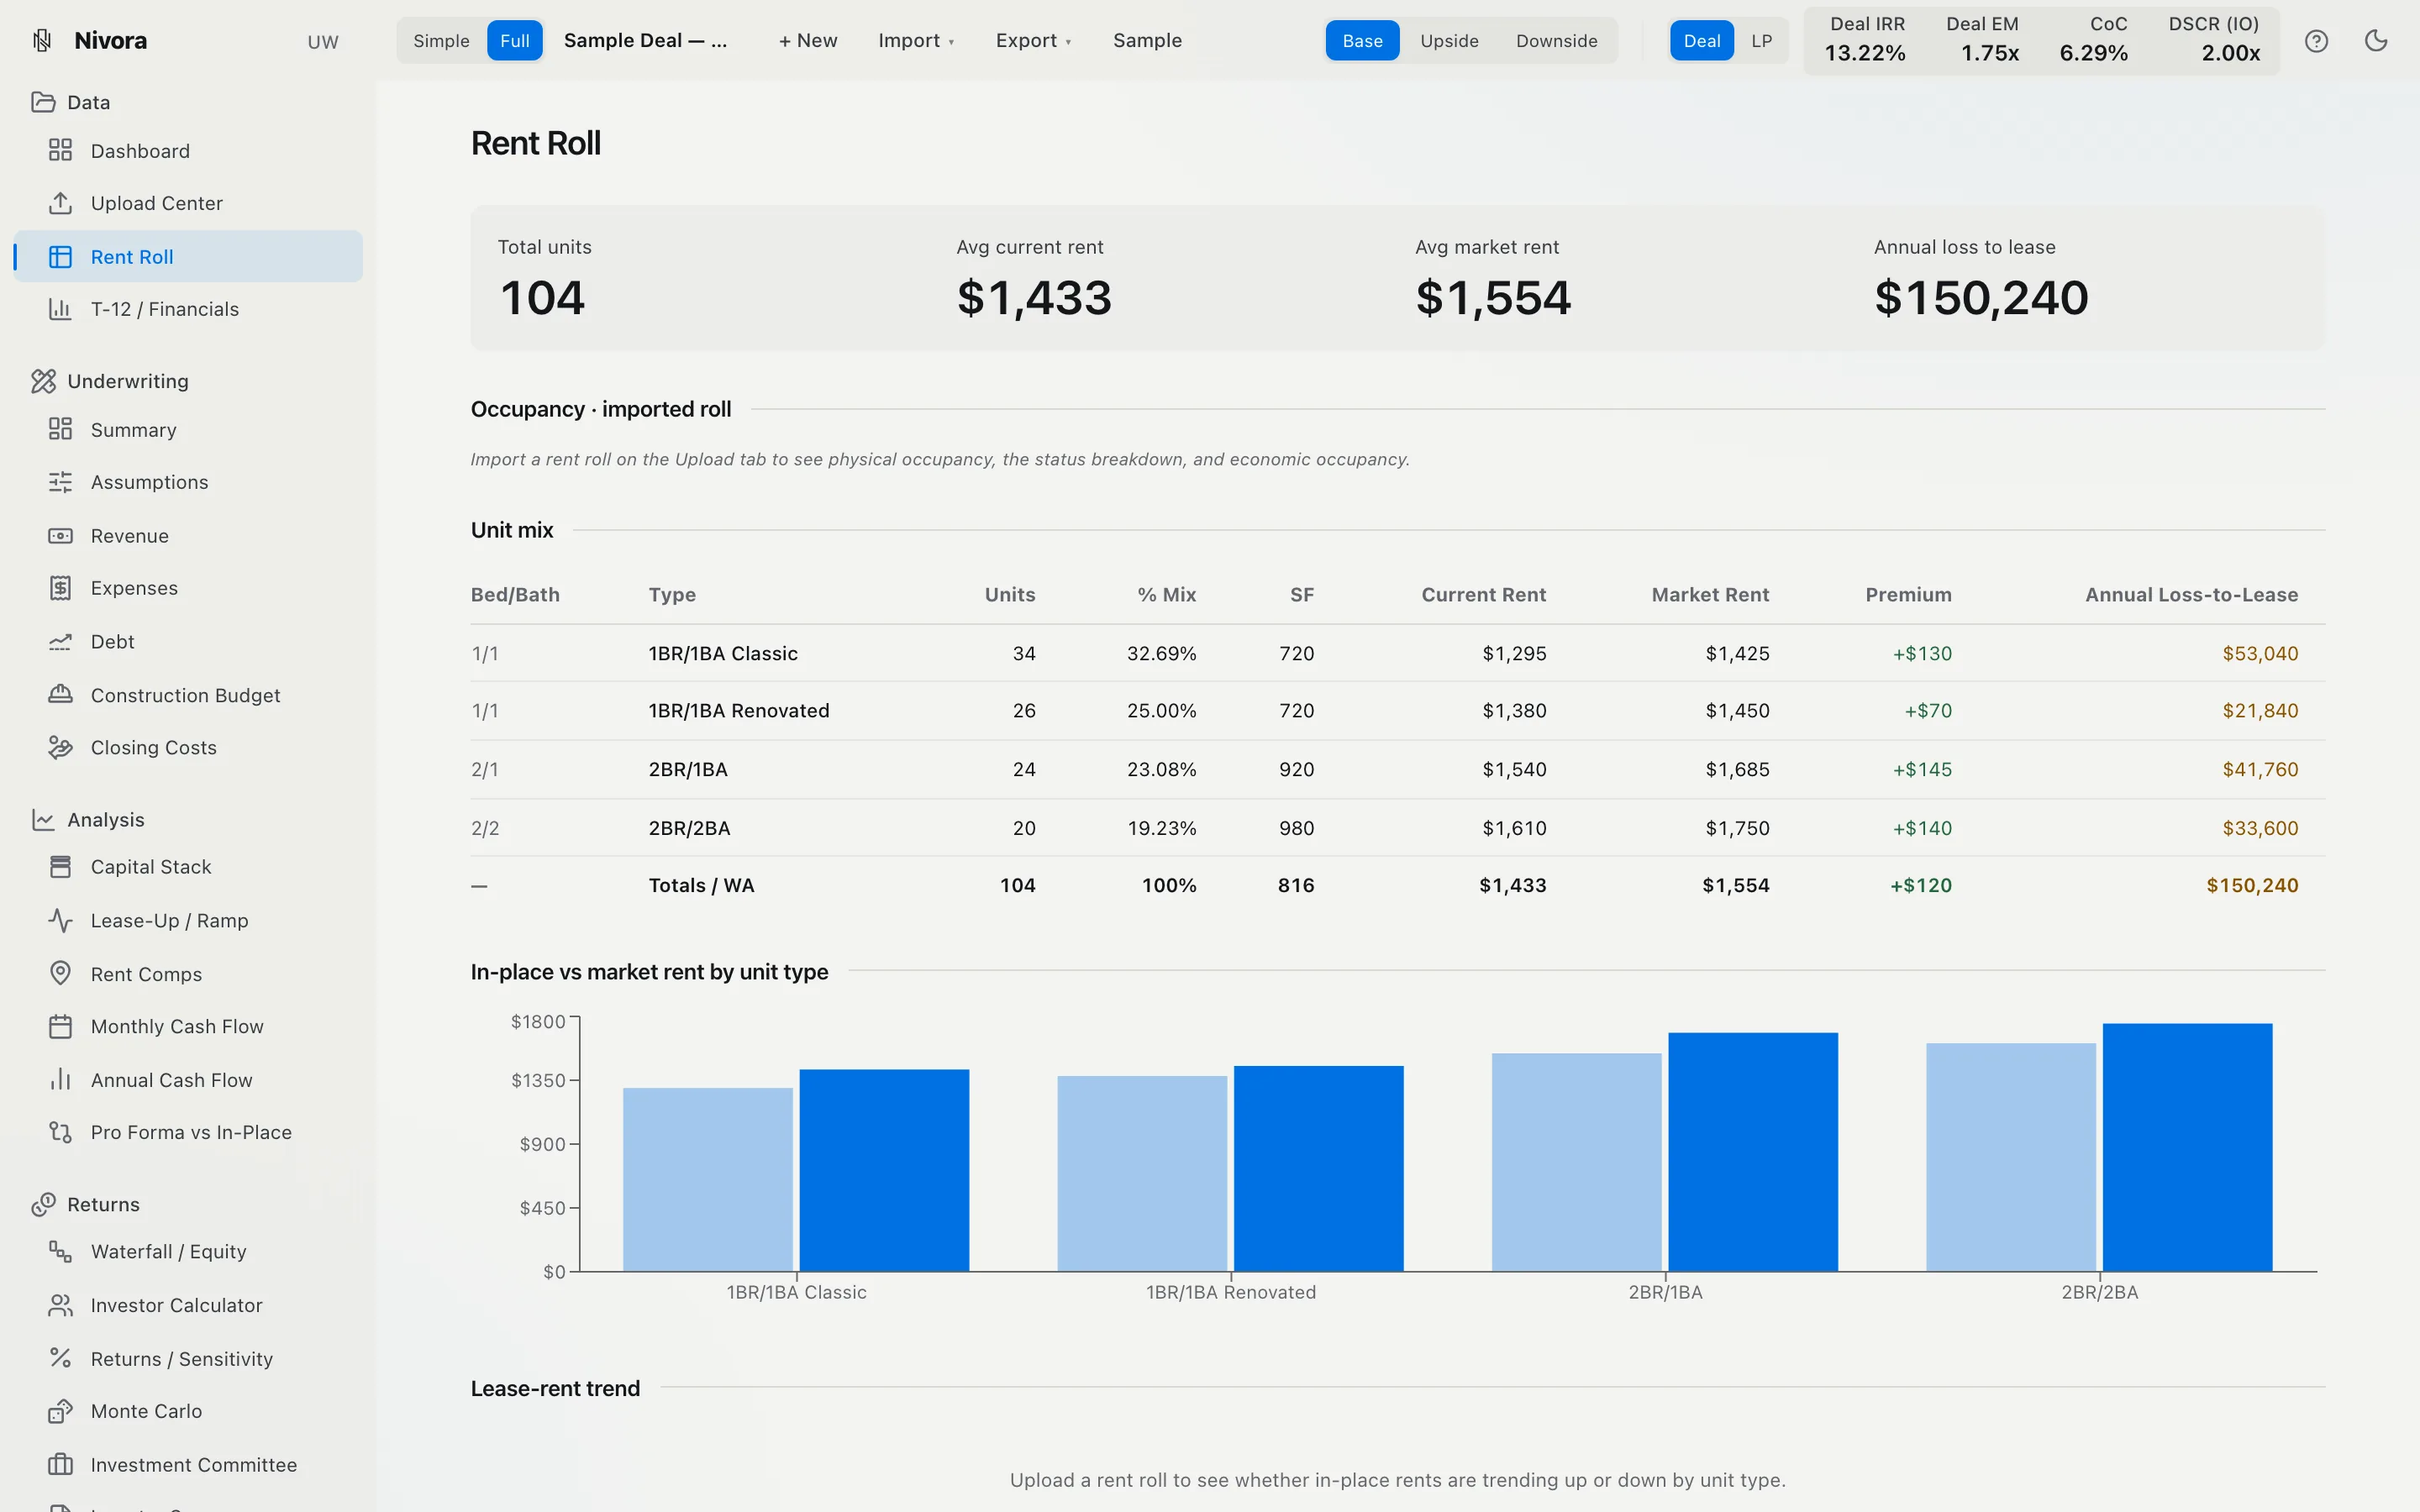
Unit mix and loss to lease
| Floor plan | Units | Leased | In-place | Market | Gap |
|---|---|---|---|---|---|
| 1BR/1BA · 650sf | 43 | 40 | $1,060 | $1,150 | $90 (7.8%) |
| 2BR/1BA · 850sf | 42 | 40 | $1,240 | $1,350 | $110 (8.1%) |
| 2BR/2BA · 1,000sf | 25 | 24 | $1,500 | $1,625 | $125 (7.7%) |
| Total, monthly | 110 | 104 | $128,000 | $139,000 | $11,000 (7.9%) |
The market column puts the leased units $132,000 a year below market. Priced at what the last 12 tenants actually signed for, the gap is $74,880, so signed leases support 57% of the claimed upside.
Lease expirations
58 of 104 leases (56%) expire or are already month-to-month within six months of Nov 1, 2026. A heavy near-term ladder cuts both ways: below-market leases can be marked up sooner, and the in-place rent is exposed to whatever the market does over the same window.
What to check before you offer
- Check58 of 104 leases expire or go month-to-month within six months. In-place rent is exposed to re-leasing over that window.
- CheckRecent signed leases support less than three quarters of the loss to lease the market column implies.
- Note2 model, employee or down units produce no rent. Make sure a quoted occupancy figure does not count them as occupied.
- NoteNo concessions appear in this file. In a soft market, check effective rent against the T-12’s collections.
What a rent roll alone can’t tell you
A rent roll shows what the leases say. Whether that rent is collected is in the T-12: economic occupancy, concessions, bad debt, and whether annualized in-place rent ties to recent collections. Nivora reads both documents, reconciles them, and carries the result into a full model with debt, returns and the investor waterfall.
How the rent roll analysis works
The tool reads the sheet with the same parser Nivora uses on upload. It finds the header row, maps the unit, status, rent, market rent and lease date columns, and turns each row into a unit. Units are then grouped into floor plans by bedrooms, bathrooms and square footage, so two spellings of the same plan are counted together.
In-place rent is the sum of the rents on leased units. Loss to lease is market rent minus in-place rent on those same units; vacant, model and down units are counted separately, because an empty unit is vacancy and not a below-market lease. The market column is then tested: each floor plan’s leased units are re-priced at the average of the leases signed in the last 90 days, which is the best evidence in the file of what the market will pay.
The steps are explained, with a worked example, in how to read a rent roll. The sample this page opens with is that example’s property. For the terms, see loss to lease and economic vs physical occupancy.
What is a rent roll analysis?
A rent roll analysis reads a property’s rent roll unit by unit to find the revenue a buyer is actually acquiring: how many units are leased, what they pay against what the market column says they could pay, when the leases expire, and whether recent leases are being signed higher or lower than older ones.
Is my rent roll uploaded anywhere?
No. The spreadsheet is read by code running on this page, in your browser. It is not sent to a server and it is not stored; closing the tab discards it. No login or email is needed.
How does the tool tell whether rents are trending up or down?
It compares the leases signed in the last 90 days with the earlier leases on the same floor plan. When at least five recent leases are on floor plans that also have earlier ones, that comparison decides the call, and a difference within 2% either way is flat. Otherwise it fits a straight line through every dated lease’s rent against its lease start date (or move-in date, when the file has more of those), and a change within 1% a year is flat. Leases with no date are left out. Working one floor plan at a time means a change in unit mix cannot pass for a change in rents.
What file formats does it read?
Excel (.xlsx) and CSV, with one row per unit and a header row. Layouts exported from the common property management systems are recognised, including charge-code rent rolls where each unit spans several rows. PDF rent rolls are read inside Nivora, not by this free tool.
How is loss to lease tested against recent leases?
The market rent column is a claim. The tool re-prices each floor plan’s leased units at the average rent of the leases signed in the last 90 days, when a plan has at least three of them, and reports how much of the claimed loss to lease those signatures support.
Why doesn’t it show economic occupancy?
Economic occupancy is rent collected ÷ gross potential rent, and collections are in the T-12 operating statement, not the rent roll. This tool reports what the rent roll can prove on its own. Nivora reads the rent roll and the T-12 together and reconciles them.
Figures come from the file as given; the tool does not verify them against leases or bank records. Not investment advice.